Electronic cartography from brands such as C-Map, Garmin Navionics+ and Vision+, Humminbird CoastMaster and Raymarine LightHouse offer a wide range of built-in chart formats and features, any one of which can be immensely useful depending on what kind of water you’re fishing or navigating.
So, how can boating anglers decide which format or function to use? To learn the answers, we talked with David Dunn, senior director of marine and RV sales for Garmin Marine, who walked us through eight charting choices to outline how and when each can prove useful to boating anglers.
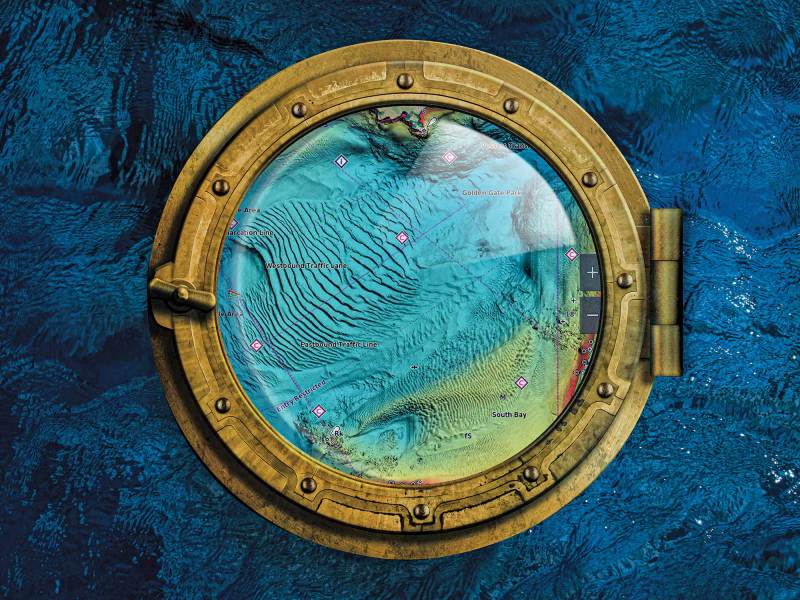
Relief Shading
For anglers, the high-resolution relief-shading chart formats represent the biggest news in charts since the invention of electronic cartography. With the relief-shading format built into many charts and multifunction displays, it’s as if you drained the ocean to see every reef, rock, ledge and wreck.
Based on bathymetric surveys by NOAA and other entities, relief shading shows the smallest of spots and the big ones in vivid, three-dimensional detail. “This is a view we’ve never had before,” Dunn says. “You don’t even need waypoints anymore to find the prime fishing spots. Relief shading opens up a lot more ocean to anglers.”
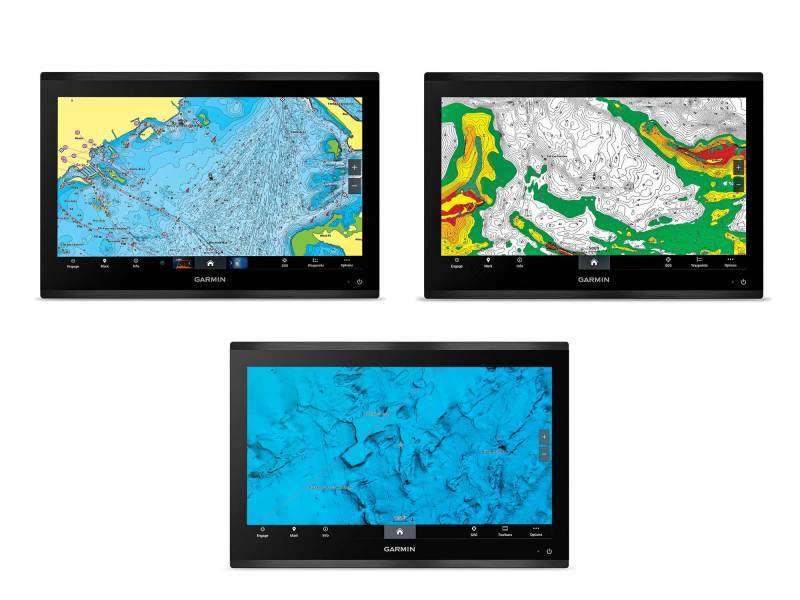
High-Resolution Bathy
Before the recent advent of shaded-relief charts, high-resolution bathymetric charts were the best thing going for locating drop-offs, depressions, humps, seamounts and other structure that might hold fish. With contours outlined in increments as fine as one foot, high-res bathy charts provide a detailed and clear view of bottom structure for anglers who know how to interpret the lines.
High-res bathy is still a valuable chart format for boating anglers. When trolling offshore, for example, these charts can be indispensable in helping you follow a productive submarine ledge or canyon wall. But it’s not just for bluewater fishing. In shallower waters, this cartography format can enhance detail in marshes, swamps, canals, harbors and tidal rivers to help pinpoint key fish-holding structure. It can also help boating anglers avoid running aground when exploring backcountry creeks and flats.
Conventional Charts
With the many new fishing-friendly electronic chart formats available to boating anglers, some of us fishermen might forget about the conventional nautical charts built into chart cards. However, navigating accurately and safely is job No. 1 for the captain of any fishing boat. The detail inherent in conventional nautical charts helps ensure safe passage to and from fishing spots, pointing the way around shoals and other submerged hazards, as well as above-water objects such as small islands, buoys, breakwaters and jetties that might not be readily visible at night or in fog.
Many chart programs include raster charts, a digital version of traditional NOAA paper charts, and vector charts, which provide a computer-generated representation of a chart that’s a bit more flexible in terms of features such as zooming in and out.
Satellite Imagery
Perhaps one of the least known built-in cartography formats is high-resolution satellite imagery, which can show what might not necessarily appear on an electronic chart, but what is visible from a high-res satellite camera to augment the cartography. To be clear, this is not real-time imagery, but rather recent satellite photos. Regardless, it can help you identify islands and objects on shore that might aid in navigation or help find inshore fishing spots.
Satellite imagery of shallow waters can also show the seabed (in all but the muddiest of waters), helping anglers find depressions and channel edges, which appear as darker shades in satellite photos, as well as structure such as commercial oyster farms that might not appear on conventional charts, according to Dunn. In addition, satellite imagery can enable safer navigation in shallow waters.
Read Next: How to Use the Chartplotter’s Tracking Function
Shallow-Water Shading
Speaking of safer navigation, the built-in shallow-water shading function on Garmin Navionics Vision+ charts permits captains to highlight certain areas such as dangerous shoals or reefs, providing a clearer picture of waters to avoid. This can help minimize the danger of running aground, be it while backcountry fishing or cruising waters festooned with shallow reefs.
“This feature lets the captain define depth that poses a danger to enhance safety, especially in unfamiliar waters,” Dunn explains.
Depth-Range Shading
The high-resolution depth-range shading function lets the captain select color-shade options to view target depths at a glance. “With the Garmin Navionics Vision+ charts, you can select up to 10 depth-range targets,” Dunn says. This can be particularly helpful to enhance the identification of steep drop-offs or seamounts when fishing offshore.
“Where I live in the Carolinas, we like to fast-troll for wahoo about 60 miles offshore,” Dunn says. “Depth-range shading helps us identify the ledges where wahoo like to feed so we can easily target these areas. We find most of the bites occur when we troll across drop-offs from shallow to deep.”
Aerial Photography
The aerial-photography feature built into many charts offers crystal-clear imagery of ports, bridges, docks, navigational landmarks and other shore objects to provide a better sense of your surroundings, especially when visibility is limited at night or in fog. “It gives you a good idea of what you are looking at when entering a new marina for the first time,” Dunn explains. You can even study the photography ahead of time to gain a better understanding of what you might encounter before heading into a new harbor channel.
Points of Interest
Community-sourced content like Garmin’s ActiveCaptain feature and Raymarine’s LightHouse POI library can prove useful in finding marine services and points of interests when fishing new waters, such as marinas, anchorages, hazards, businesses and more. You can also tap into ActiveCaptain recommendations from boaters with firsthand local experience to learn their favorite fuel docks, tackle shops, bait vendors, boat-friendly shoreside eateries and more.
Crowdsourced ActiveCaptain updates occur daily. “With an active subscription to Garmin Vision+, a user gets up-to-date data pushed directly to their plotter through ActiveCaptain instead of waiting for a new version of the cartography,” Dunn says.
The latest chart features make it easier and safer to navigate to fishy areas.